
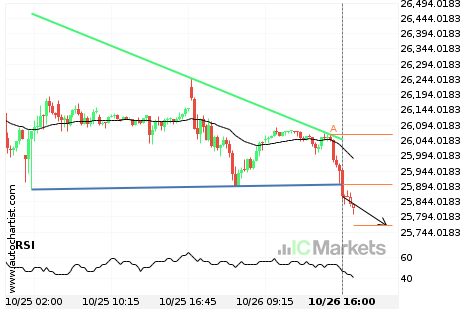
Should we expect a bearish trend on Hong Kong 50 Index?
The breakout of Hong Kong 50 Index through the support line of a Descending Triangle could be a sign of the road ahead. If this breakout persists, we may see the price of Hong Kong 50 Index testing 25766.4978 within the next 7 hours.

Should we expect a bearish trend on Hong Kong 50 Index?
The breakout of Hong Kong 50 Index through the support line of a Descending Triangle could be a sign of the road ahead. If this breakout persists, we may see the price of Hong Kong 50 Index testing 25766.4978 within the next 7 hours.

Australia 200 Index – getting close to support of a Rising Wedge
Australia 200 Index is moving towards a support line. Because we have seen it retrace from this line before, we could see either a break through this line, or a rebound back to current levels. It has touched this line numerous times in the last 14 days and may test it again within the next […]

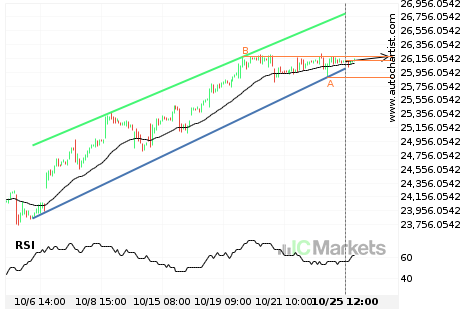
Will Hong Kong 50 Index have enough momentum to break resistance?
Hong Kong 50 Index is heading towards the resistance line of a Channel Up and could reach this point within the next 2 days. It has tested this line numerous times in the past, and this time could be no different from the past, ending in a rebound instead of a breakout. If the breakout […]
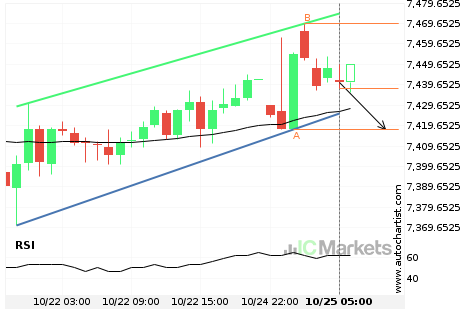
Australia 200 Index – getting close to support of a Flag
Australia 200 Index is moving towards the support line of a Flag. Because we have seen it retrace from this line before, we could see either a break through this line, or a rebound back to current levels. It has touched this line numerous times in the last 4 days and may test it again […]
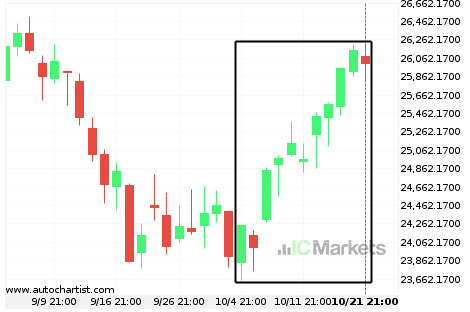
Huge bullish move on Hong Kong 50 Index
Hong Kong 50 Index has moved higher by 7.21% from 23,825.5 to 25,990.1 in the last 18 days.

Huge bullish move on Hong Kong 50 Index
Hong Kong 50 Index has moved higher by 7.21% from 23,825.5 to 25,990.1 in the last 18 days.
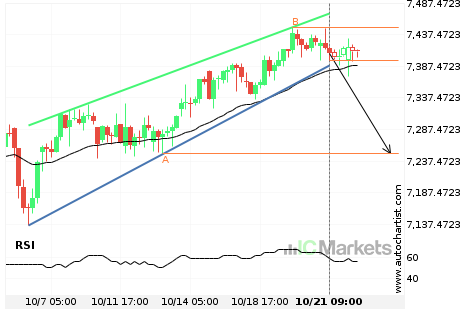
Australia 200 Index – getting close to support of a Channel Up
Australia 200 Index is moving towards the support line of a Channel Up. Because we have seen it retrace from this line before, we could see either a break through this line, or a rebound back to current levels. It has touched this line numerous times in the last 16 days and may test it […]
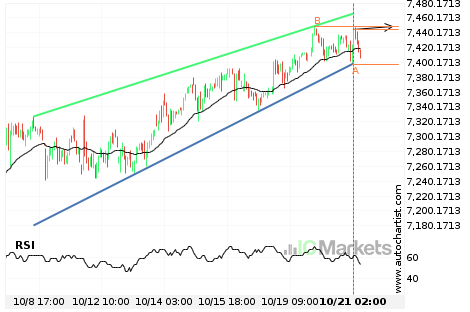
Australia 200 Index – getting close to resistance of a Rising Wedge
Australia 200 Index is moving towards the resistance line of a Rising Wedge. Because we have seen it retrace from this line before, we could see either a break through this line, or a rebound back to current levels. It has touched this line numerous times in the last 13 days and may test it […]